Some overall observations based on the 5 year AP data:
- The overall number of students taking the tests has doubled over the last 5 years. It is indeed impressive that so many students take the AP test each year. Fully 17% of all students took at least 1 AP exam last year. Each AP student took an average of 2 exams. Do we know how this compares to other schools? If would be nice to compare this percentage to other schools in general, and also to schools with similar demographics.
- In each of the last fives years,
the overall percent of passing scores at Logan has been
higher than the state average - though that gap has
narrowed recently.
- The overall numbers look pretty good, but there is wide variation by subject. Examining the numbers by subject reveals many interesting stories (see below). I wonder how the roll-out of the common core will influence these numbers. It's too bad we cannot isolate its influence from other factors like the roll-out of the chromebooks and other changes.
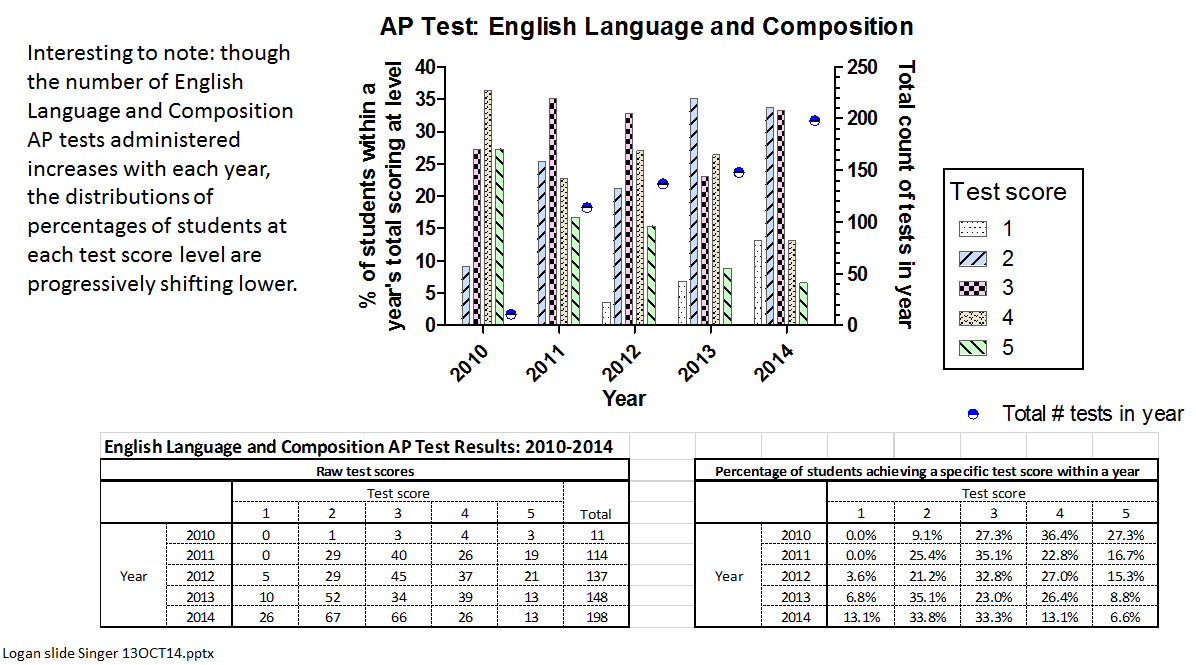
- The percent of
students with AP scores of 3 or better has been dropping
over the last 4 years (74.3%, 71.4%, 67.3%, 66.5%)
while state averages held steady at about 64%. I'm pretty sure the reason for this
is increased participation as a result of open
enrollment. There are more students taking the test now
than ever, but there has been a corresponding drop in
scores in most cases. The following chart, from Robert
Singer, shows the changing distribution over the 5 years
for one subject (English). The pattern is very similar
on other subject. If the drop in scores were only
from more low scores, then one could assume that open
enrollment was at least harmless, but the disturbing
trend is that the highest scores have dropped as well.
Some interesting Facts about Specific Subjects:
- Art History - Only one student took the Art History exam in the last 5 years. Probably there are no AP level art history classes at Logan.
- Biology - Fairly solid results. About 100 Logan students take it each year. Average scores are generally above the state and global averages.
- Calculus AB - About 100 students take it each year, but scores have been trending down slightly over the last 5 years. Average scores have been lower than state averages for the last 4 years - with last year being the worst difference.
- Calculus BC - An increasing number of students have been taking the test (doubled to 86 over the last 5 years), but there has been a slight downward trend over the last 4 years. Average scores roughly match state averages, with a small dip last year. Similar trends for the BC:AB subscore.
- Chemistry - Average scores are significantly lower than state and global averages for each of the last 5 years. The number of students getting 5's has been steadily decreasing, with no students gettig a 5 last year. Only about 20-30 students took the AP chem tests in the last 4 years, compared to 5 years ago when 49 students took it (in 2010).
- Chinese Culture and Language - About 20 students each year. Scores are very high and inline with state averages. It would be interesting to know the demographics of students taking this exam.
- Comparative Government and Politics - Few Logan students have ever taken this exam, and none took it in the last two years. Are there no Logan courses that cover this topic?
- Computer
Science A -
Prior to last year, the annual scores at Logan were
roughly in line with the nationwide average. Last year,
however, there was a staggering drop to less than half
the prior year average. 20 out of the 27 students that
took the exam got a 1 (the lowest score possible). There
were triple the number of students taking it last year,
but they were clearly not prepared - and probably did
not even know they were not prepared. None of the
students got a 5 last year. I know that last year, Ms Banther
took a different approach to teaching the material. She
decided to focus on only the A material, rather than the
the more comprehensive AB (full year) material. I have a
theory that many of the students found the class easy
and got good grades, and as a result assumed that they
would also do well on the AP test. It is a very hard
test, but nationally, of those that took it, over 50%
got a 4 or 5.
Last year, I offered to administer a free practice CS AP exam through the Computer Science Club. Only two students form the AP CS classes attempted the practice exam, even though it was widely advertised. I will try again this year. It's great that more students are taking this exam, but it's critical that those taking it are prepared for it. - English
Language and Composition - Dramatic
rise in the number of students taking the exam since
2010. Average scores have been trending down - steadily
falling from 3.8 in 2010 to 2.7 in 2014. Average scores
have been higher than state and global in 4 of the last
five years. Only last year did the average drop below
state and global.
-
English Literature and Composition - Double the number of students took the exam last year, and there was a corresponding drop in scores, but the average, even last year, was higher than the state average.
-
Environmental Science - Very few students take this test - just 2-5 each year. Scores are in line with state averages.
-
European History - Very few students take this - just one or two each year. Those that take it do pretty well. Does Logan even offer a course on European history?
-
French Language and Culture - Very few students take this - just 2 in 5 years.
-
Human Geograhy - Very few students take this - just 3 in 5 years. I had never heard of this one before, but it seems like it would fit nicely into Logan's ethnic studies curriculum.
-
Japanese Language and Culture - Very few take this - just one or two each year. However, every single student that has taken this AP exam in the last 5 years has gotten a 5 on it! Japanese is not offered at Logan.
-
Macroeconomics - Over 100 students take this annually and it is steadily increasing. Scores have been dropping with increase test taking, but are roughly in line with state averages.
-
Microeconomics - Only about a half dozen students take this each year. Scores are roughly in line with state averages.
-
Music theory - Very few take this, but they do fine when they do.
-
Physics B - About 80 students take this in recent years. Scores tend to be a little higher than state and global averages.
-
Physics C - Very few take these variants, but when they do, they do fine. It might be good if Logan could offer a course in Mechanics, so that the numbers taking the Mechanics variant could be closer in proportion to overall California state number taking it.
-
Psychology - About a dozen take this each year. Scores are higher than the state average, and actually trending higher over the last three years
-
Spanish Language and Culture - About 40-60 took it in recent years. Scores are roughly in line with state averages, but have been trending down with a corresponding increase of test takers.
-
Spanish Lit and Culture - Only two students took this test in 5 years, and they did not perform well on it.
-
Statistics - Very strong performance by Logan. About 100 students take it annually and their scores have consistently been much higher than state and global averages. I don't know who the teacher is, but he or she seems to be doing a great job of preparing students for this exam. Another possible explanation is that it is common for Logan students to take statistics after or concurrently with a Calculus AP class. That may not be as common elsewhere.
-
Studio Art 2-D design Portfolio - About a half dozen students submit portfolios each year, and do reasonable well - but none have ever gotten a 5 in the last five years.
-
US Government and Politics - Test takers have doubled in the last 5 years (from 75 to 142), while scores have trended down from 3.2 to 2.5. Scores are roughly in line with state and global averages.
-
US History - No appreciable increase in number test takers over the 5 years - about 60-70 take it each year. Scores have been consistently higher than state and global averages.
-
World History - Number of test takers has been flat - about 150 each year. Scores have been consistently higher than state and global averages.
It's interesting
to compare the percent of students taking subject exams
with the percent state wide. These numbers assume
Logan enrollment is 4000 and CA state HS enrollment is 1.5 million. Since this is just for
comparing percents, it does not matter much if those
estimates are off.
| Biology | 0.025% | 0.024% | |
| Calculus AB | 0.025% | 0.033% | |
| Calculus BC | 0.022% | 0.013% | higher than state proportionally |
| Chemistry | 0.005% | 0.014% | |
| Computer Science | 0.005% | 0.004% | hardly anyone takes this in CA, but globally the numbers are higher |
| English Lang | 0.05% | 0.053% | This and English composition are very common tests to take |
| Environmental Sci | 0.0005% | 0.015% | becoming very common for CA state test takers, but not at Logan |
| European History | 0.0% | 0.018% | very common for CA state and globally, but not at Logan |
| Human Geography | 0.0% | 0.006% | very common globally, but not common in CA or at Logan |
| Macroeconomics | 0.033% | 0.011% | higher than state proportionally |
| Microeconomics | 0.002% | 0.007% | |
| Physics | 0.019% | 0.011% | slightly higher than state proportionally |
| Psychology | 0.0025% | 0.021% | |
| Spanish | 0.0015% | 0.029% | less than 1/10 the amount of students compared to the state proportion |
| US Government | 0.035% | 0.031% | |
| US History | 0.017% | 0.049% |
Recommendations
The following are some ideas I have. I don't know what impact they would have, but they would be good to discuss.
Collect more data:
- For each subject, of those that took the AP class. what percentage took the AP exam?
- Can we combine the AP data with additional data in an anonymized way? For example, could we know for all the students that got a 1, what what their average grade in the class? If all the students who got 1's also got A's in the class, that might be cause for concern. There should be a strong correlation between the two, but how strong?
- Usually there is only one teacher teaching an AP course in any given subject, but if there were more than one, or if the teacher changed from one year to the next, then the AP test score results between the two teachers should be compared. There may not be enough students taking the test to make a statistically significant comparison, but its a data point to consider.
- Post the data publicly so that we can discuss it and see problems (or good things) when they happen. It would be nice if the data could be on the school website each year. It would help parents and students to set expectations.
Specific actions:
- For some classes, especially where results have been trending lower, and lab work is not required, can we offer students an online alternative? In other words, students would have an option to go to a quiet room and take the class online. The students pursuing this option would still have a chance to ask their teacher for help, and they may choose to go to the regular classroom when special events are happending, but primarily they would satisfy that course's requirements online. The teacher can track their progress and intervene if necessary. Exams can be proctored by the teacher. Do not quickly dismiss this proposal. Online classes have improved dramatically over the last few years. The quality of instruction and level of interaction with others worldwide, is probably much greater than is possible in a traditional classroom. For many students, especially those that are advanced, an online curriculum allows them to proceed much further and faster than otherwise. This article gives an overview of how it could work. This online AP Computer Science class is a perfect example of what I am talking about. It is free, and only requires a "coach" to monitor student progress.
- A similar option would be a flipped classroom - where the student watches interactive lectures by world-class professors online at home on their chromebook, and does homework, lab work, projects, and group activities in the classroom where the teacher can assist.
- Have an introductory programming class before the AP CS class, and make the AP CS class much more rigorous so that students are well prepared. Students should be able to skip the introductory class if they can pass a test to place into the AP version.
- In every subject, students should have an opportunity to take a practice exam to see how they will do. This exam should not happen during class time. The student would take it home and it would be later graded by the teacher or parent volunteers. Since the score is just for informational/preparatory purposes and not a grade, there would be no incentive to cheat. Perhaps the practice test could be given by parent volunteers under simulated conditions.
Scores are dropping as a result of having an increasing percentage of students take the exam. This may well be a worthwhile trade-off, but we should understand the pros and cons. There are two points, however, that are incontrovertable in my mind:
- Students should always be allowed to take any AP exam if they want to.
- Students should have some idea of how they will do before they take the exam, so that they can make an informed decision.
Thank you to Logan
administrators for making this 5
year AP data available.
- Barry Becker
10/18/2014